Foremost, I would like to apologise to the readership for the lack of uniformity in publishing blog entries; it is currently the pointy end of the semester, and examinations are taking precedence over almost everything else, sadly this includes writing blogs about skiing, and more importantly skiing itself. The tortuous thing is, as I sit here lamenting over how challenging life can be as a student, not having the time to ski, I can very clearly see the snow-capped southern alps. Mt Hutt is open after having to push back their opening date by a week, and while the coverage is still rather skinny, it is still very early in the season. As the adage goes, “snow in June is still too soon.” So do not fear, as snow will undoubtedly arrive, and hopefully with daily homage to the snow gods, we will enjoy a deep July through to September. These are facts that I remind myself of every 10 minutes, as I salivate over powder dreams.
If one were to open Google Chrome on my computer, they would find my top sites listed as follows: Metvuw, Metservice, Snow.co.nz, and snow-forecast.com. Weather plays an integral part in our beloved sport, and during winter I can be found perpetually scrolling through sites in an effort to predict where I should go for my next truancy outing. Once the days get shorter, I begin to eat, breathe, dream, and live snow, so it is of vital importance that I maintain a close eye on weather systems, and tailor my life accordingly. Through repetition, and countless hours of reading B grade blogs (hopefully not a category this falls into!), I have taught myself to read weather maps. This is a skill every avid skier should have, because it provides a far more accurate picture of what is going to happen, and whether there will be coveted snow or wretched rain.
For snow to be formed, two things are required:
1. An atmospheric temperature below 2°C
2. Sufficient moisture in the air.
A snow flake is, in essence, an ice particle that grows from air moisture, and falls as precipitation. Where the ground temperature is cold enough, this will settle, forming a snow base. As snow falls, it will settle into layers of various densities, which in turn, when combined with slope gradient, can give rise to phenomena like slab and slough avalanches, but that can be left for another day; the good thing is Whakapapa ski patrol undertake extensive avalanche control so all you have to worry about is the white stuff falling and getting out skiing.
Most weather maps we are exposed to will show mean sea level isobar systems. These are the squiggly lines that Jim Hickey points to. They demonstrate areas of uniform air pressure, measured in hectopascals (hPa), which is a measure of weight per square area of atmosphere. Stick with me. In New Zealand (and anywhere else in the Southern Hemisphere), high weather systems, illustrated by a big H in the middle, have counter-clockwise air flow, and low weather systems, illustrated by a big L in the middle (bet you wouldn’t have guessed!), have clockwise air flow. An easy way to figure out what is going on is to remember the three L’s: when you look into the wind, the low is to your left.
In addition to our ability to predict the direction of airflow from high and low weather systems, isobars also illustrate the strength of the airflow. The general rule of thumb is where isobars are grouped close together, the wind speed will correspondingly be higher.
The majority of New Zealand’s snow fall occurs when cool Antarctic air is dragged up from the south (typically the Ross Sea), and clashes with warm moist air from the Tasman. Where the cold air mass wins the fight, this creates a cold front, which forces they typically moist warm air upwards. This movement forms precipitation clouds, which in turn as the water vapour cools and freezes, will fall through the cold air mass landing as snow:
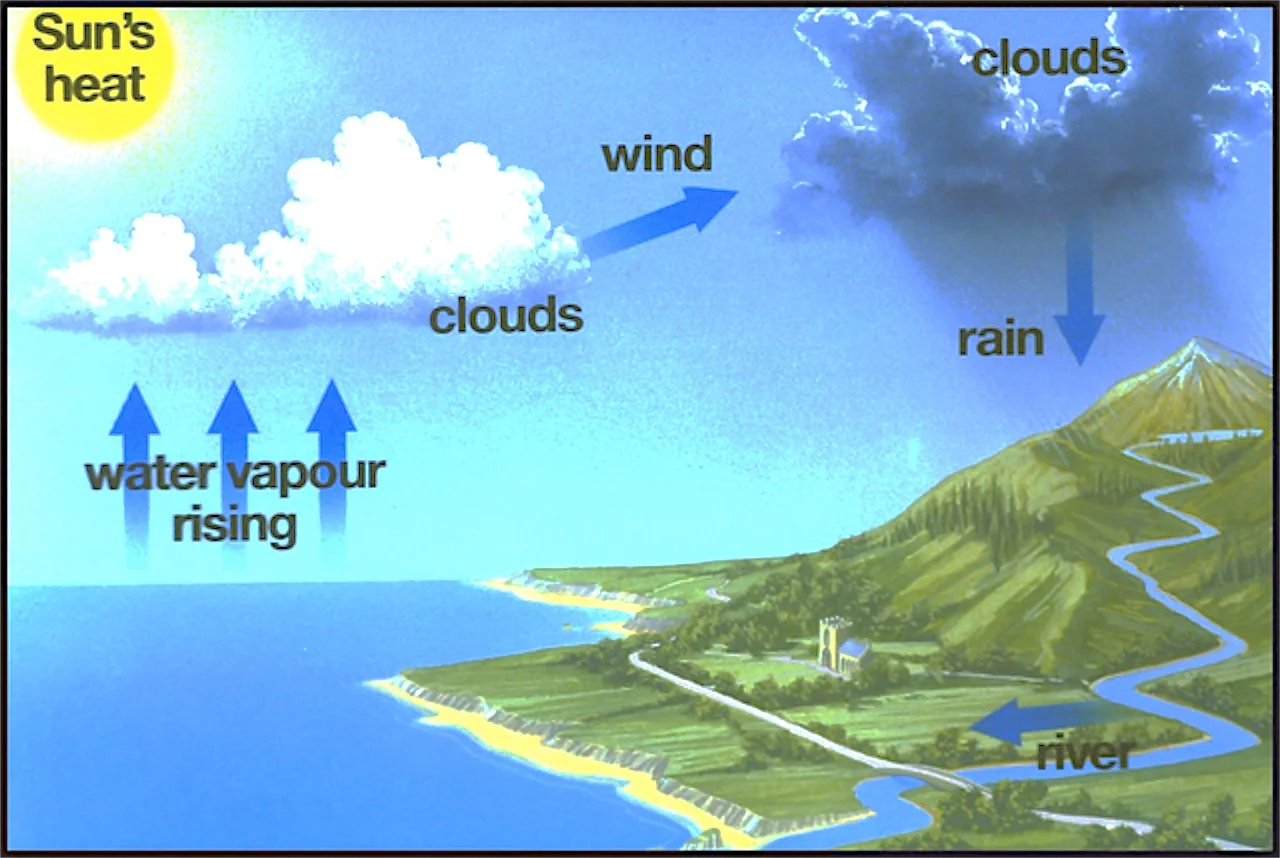
This diagram, while somewhat rudimentary, is a good illustration of what I have touched on. The warm moist air mass is on the left; the cold air mass is on the right. As the two clash, the cold air mass forces the warm air upwards, meaning the moisture freezes and falls as precipitation (and where the atmospheric temperature is cool enough, it will fall as snow.
After all of this, it is often just as easy to go to metservice.com, and find the Whakapapa tab, which will give an estimated snowfall prediction. But I don’t think it is quite as fun. Hopefully I have armed you with a little more knowledge on how to predict the fresh stuff.
In other news, the Takapuna Ski Club pre-season shin dig is going down at Ballistics in Takapuna this Saturday at 6pm (June 19). It is a BYO so go along, have a drink, chow down on the provided nibbles, and talk rubbish about “how sweet that cliff huck last season” was, or where your “super advanced, extra secret spot on Whakapapa” is. Plus it will give you an opportunity to exercise your new knowledge about skis and outerwear. It will really be an excellent evening, and get you super pumped about this season.
That is it from me for the moment. Go read some weather maps and apply your knowledge, and head into Ballistics for a pre-season catch up – it will be epic. Until next time, make sure you're all praying for snow.
Dylan Pine.